
TABLE OF CONTENTS
Overview
Debugging is an essential aspect of developing robust Vue.js applications. With the increasing complexity of modern web applications, having effective debugging tools and techniques is crucial for identifying and resolving issues efficiently. This article explores various methods and tools that can help developers debug Vue.js applications more effectively, including advanced console logging techniques, using Vue Devtools, debugging Vue’s reactivity system, and utilizing Proxyman for network debugging.
Effective Use of Console Logging
The Console API is a powerful debugging tool that involves displaying messages or data directly in the browser’s developer console. It helps real-time debugging by logging messages, identifying issues, tracking variables, and timing operations in code. There are more than 15 console logging functions available. This section focuses on the most commonly used for debugging.
Placeholders in console.log()
Use placeholders to format your log messages and inject variable values. This makes your console messages more readable and informative by embedding dynamic data seamlessly. The different placeholder types include:
- string = %s
- integer = %i or %d
- object = %o or %O
- float = %f
- apply CSS rules = %c

Styling console.log()
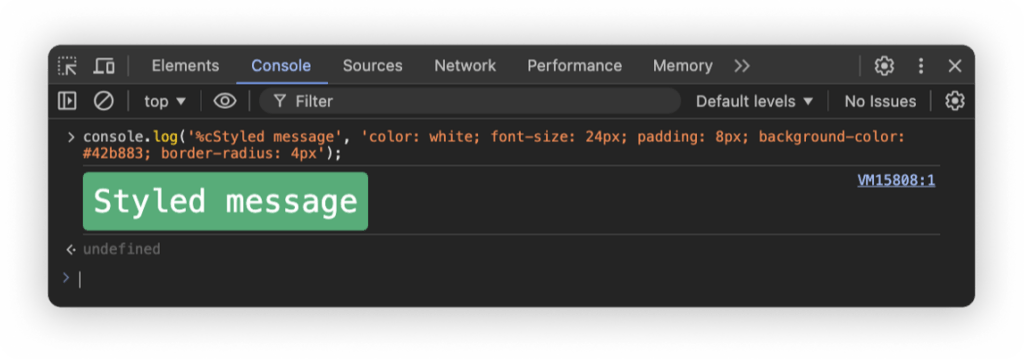
Apply CSS styles to your console messages using the %c placeholder in console.log(). Styling important logs helps them stand out visually, making it easier to spot key information during debugging.
console.group() and console.groupEnd()
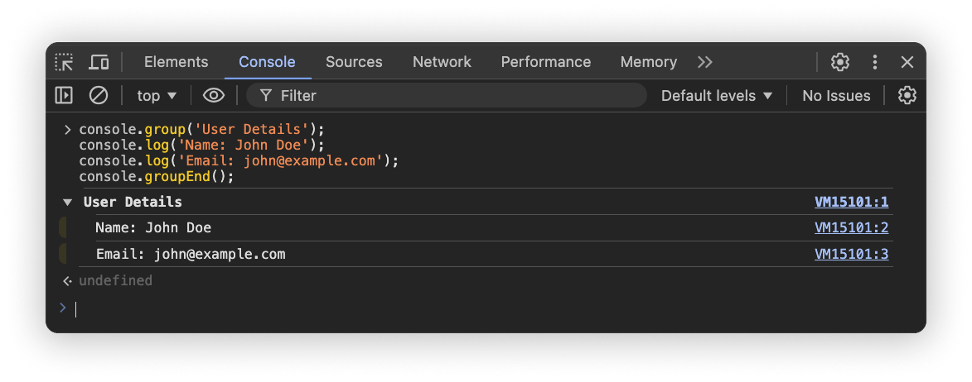
Organize related logs into expandable groups. This structure is particularly useful for logging sequences of related operations, such as API calls or component lifecycle events, allowing you to expand or collapse them as needed for a cleaner and more organized console output.
- console.group(): Starts a new group
- console.groupEnd(): Ends the current group
console.table()
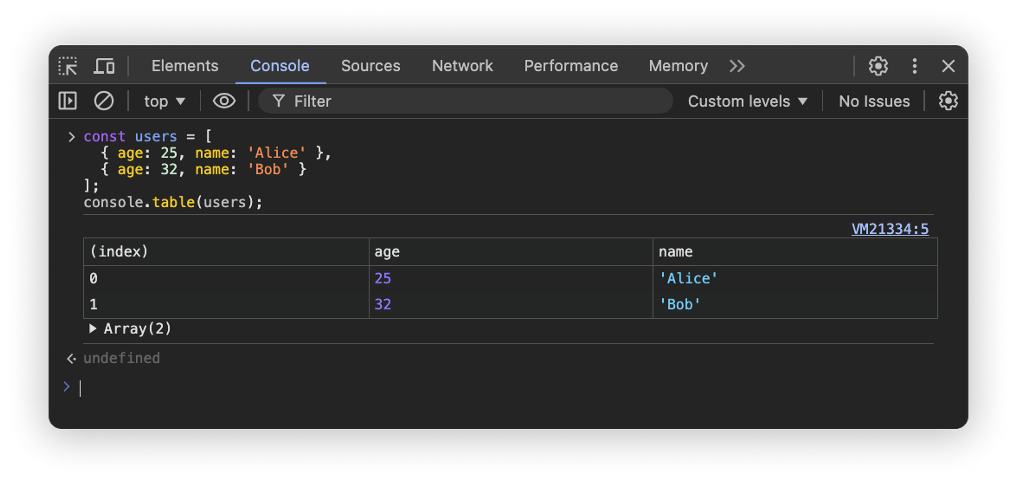
Display arrays or objects in a tabular format within the console using console.table(). This makes it easier to read and compare data, especially when dealing with large datasets or complex structures.
console.assert()
Log a message only if a specified condition is false using console.assert(). This method helps you catch and highlight unexpected conditions or errors in your code without interrupting execution.

console.count() and console.countReset()
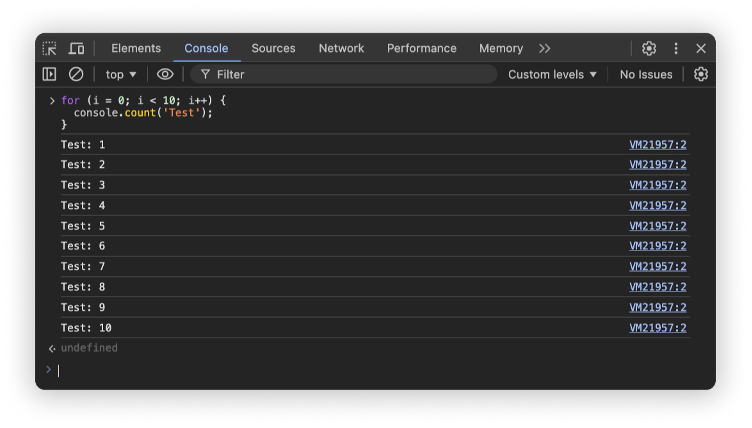
These methods help keep track of how many times a particular piece of code is executed, incrementing a counter each time it’s called. Use console.countReset() when needed to reset to reset the counter:
- console.count(): Increments the count for the label
- console.countReset(): Resets the count
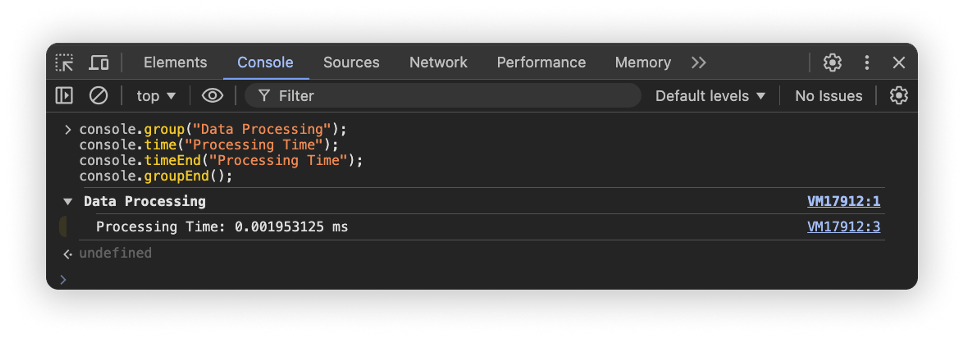
console.time() and console.timeEnd()
They are mostly useful to measure how long a function or code block takes to execute by wrapping it with console.time() and console.timeEnd()
Using Vue Devtools
Vue Devtools is a browser extension for developers working with Vue.js applications. Available for Google Chrome and Mozilla Firefox browsers, it integrates directly into your browser’s developer tools. It provides real-time insights into your application’s components, state, events and performance.
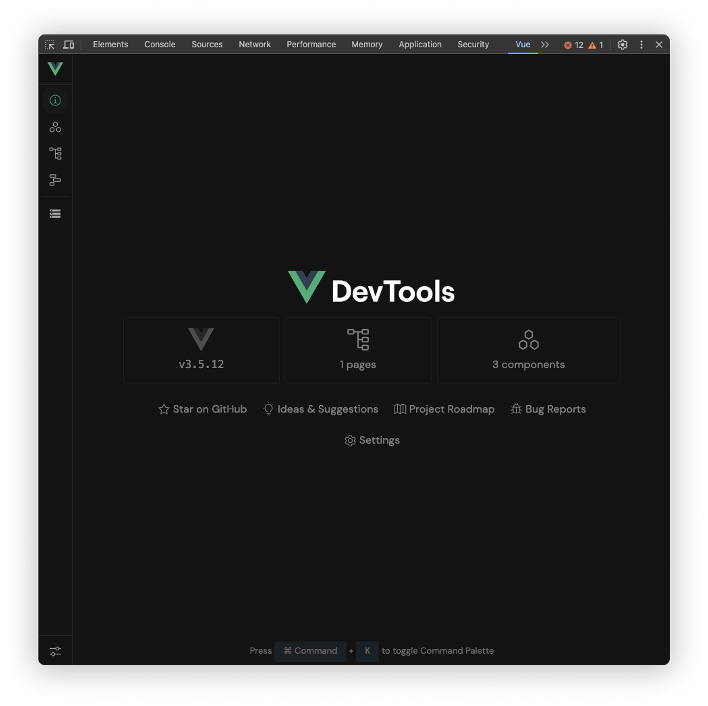
Key Features
Component Inspection
Vue Devtools allow you to explore the component hierarchy of your Vue.js application in real-time. The Components tab displays a tree-like structure of all components currently mounted in your application. By selecting a component, you can:
- View Props and Data: Inspect props passed to components and their internal data. This is crucial for understanding how data flows through your application
- Inspect Computed Properties and Watchers: Examine how computed properties and watchers are associated with components to ensure they are working as intended
- Check Lifecycle Hooks: Observe the lifecycle hooks triggered during a component’s lifespan, aiding in debugging initialization and cleanup processes
State Management Debugging
For applications utilizing Vuex or Pinia for state management, Vue Devtools offers dedicated Vuex and Pinia tabs:
- State Inspection: View the entire Vuex or Pinia state
- Mutation Tracking: Monitor mutations as they occur, complete with timestamps and payload data
- Time-Travel Debugging: Travel back and forth through previous states by replaying mutations, allowing you to pinpoint exactly when and where state changes resulted in defects
Routing Inspection
For applications using Vue Router, the Devtools include a Routing tab:
- Current Route Details: View the current route’s name, path, and parameters
- Navigation History: Examine the sequence of navigated routes to understand how users interact with your application
- Route Matching: Check which components are rendered for specific routes, assisting in debugging routing issues
Performance Profiling
It is the best tool to identify slow components and optimize rendering performance. Vue Devtools’ performance profiling tools enable you to:
- Record Performance Traces: Capture and analyze rendering performance over time
- Component Render Times: Identify components that take longer to render, highlighting potential bottlenecks
Error Tracking
Vue Devtools assists in capturing and diagnosing errors:
- Error Logs: Access a log of runtime errors with detailed stack traces
- Source Mapping: Link errors back to your source code for quicker identification
Visual Graphs
Visual representations of your application structure as a network graph. It can help to simplify understanding of complex applications:
- Component Graphs: Generate visual graphs of your component structure, illustrating relationships and hierarchies
- State Flow Diagrams: Visualize how data flows through your application, from state, to props, to UI changes
Debugging Vue Reactivity
One of the most challenging parts to debug is reactive data. While Vue’s reactivity system automatically tracks dependencies, in some cases, you may want to figure out exactly what is being tracked, or what is causing a component to re-render. Fortunately, in Vue 3, there are two functions, onRenderTracked and onRenderTriggered, that help to debug easily:
- onRenderTracked runs when your component reads reactive data during the render
- onRenderTriggered runs when reactive data changes and causes the component to re-render
<template>
    <div>
        <p>{{ count }}</p>
        <button @click="increment">Increment</button>
    </div>
</template>

<script setup>
import { ref, onRenderTracked, onRenderTriggered } from "vue";

const count = ref(0);

onRenderTracked((event) => {
    console.log("Component is tracking reactive data", event);
});

onRenderTriggered((event) => {
    console.log("Component re-rendered due to reactive data change", event);
});
</script>
The DebuggerEvent provides information about the reactive data that was accessed or changed, and has the following structure:
type DebuggerEvent = {
  effect: ReactiveEffect
  target: object
  type:
    | TrackOpTypes /* 'get' | 'has' | 'iterate' */
    | TriggerOpTypes /* 'set' | 'add' | 'delete' | 'clear' */
  key: any
  newValue?: any
  oldValue?: any
  oldTarget?: Map<any, any> | Set<any>
}
Note: Component debug hooks only work in development mode
Computed and Watchers Debugging
Debugging can also be used within computed properties and watchers to monitor reactive dependencies and what triggers them:
- onTrack: Monitors when reactive dependencies are accessed during their execution
- onTrigger: Tracks when changes in reactive dependencies cause the computed property or watcher to re-evaluate
computed(() => value, {
    onTrack() {
        debugger;
    },
    onTrigger() {
        debugger;
    },
});

watch(source, callback, {
    onTrack() {
        debugger;
    },
    onTrigger() {
        debugger;
    },
});

watchEffect(callback, {
    onTrack(event) {
        debugger;
    },
    onTrigger(event) {
        debugger;
    },
});
The debugger statement in JavaScript is a built-in keyword that invokes any available debugging functionality. When the JavaScript interpreter encounters this statement, it pauses execution at that point, allowing you to inspect the current state of your application through developer tools.
Utilizing Proxyman for Network Debugging
When developing Vue.js applications, you need to interact heavily with APIs and backend services, and effective network debugging becomes crucial. Proxyman is a powerful tool designed to intercept, inspect, and manipulate network traffic for debugging purposes. It offers intuitive features to help developers debug issues effectively and improve application performance.
Key features
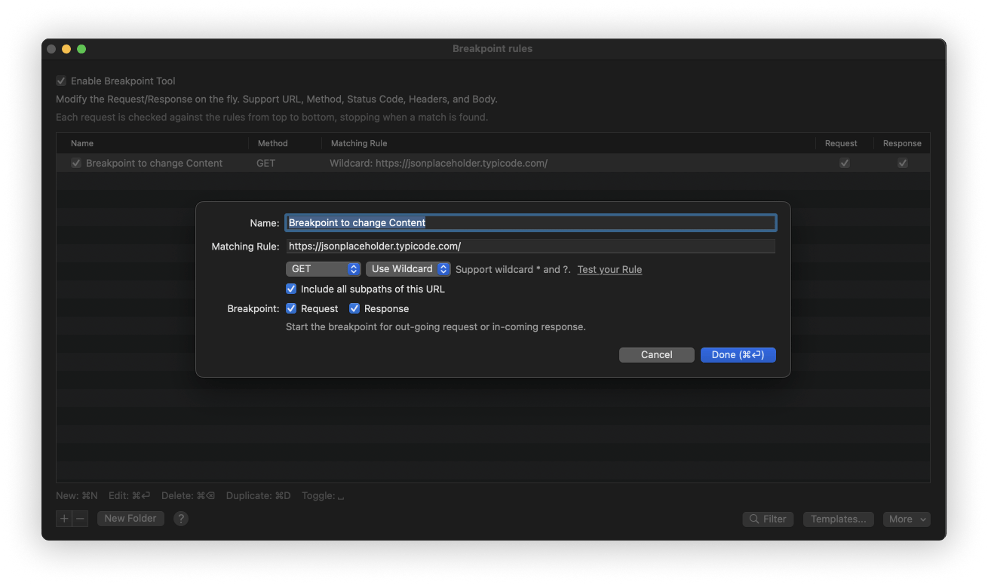
Breakpoints
Breakpoints in Proxyman function similarly to code breakpoints in an IDE and browser, but are applied to network traffic. They allow you to intercept and modify HTTP/HTTPS requests and responses before they reach the server or client
- Enable Breakpoint for request: Proxyman will stop the request before it goes to your server
- Enable Breakpoint for response: Proxyman will stop the response before it reaches your application
Use Cases:
- Debugging authentication by modifying Authorization, Cookie, and Set-Cookie Headers
- Testing how your application handles unexpected data or errors
- Simulating different server responses without changing backend code
Map Local
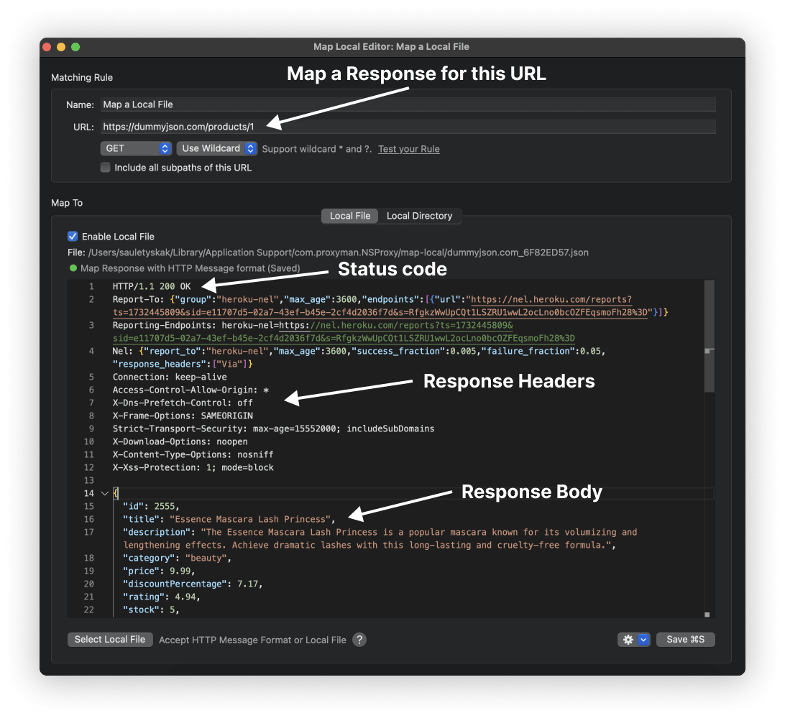
Map Local allows you to redirect network requests to local files on your machine. This means Map Local helps you to use the content of local files as an HTTP Response to your requests.
Use Cases:
- Replace API responses with local JSON files to test how your app handles different data scenarios
- Serve modified versions of JavaScript, CSS, or image files without altering the production server
- Developing and testing UI components with different data sets
- Rapid prototyping without needing backend changes
Map Remote
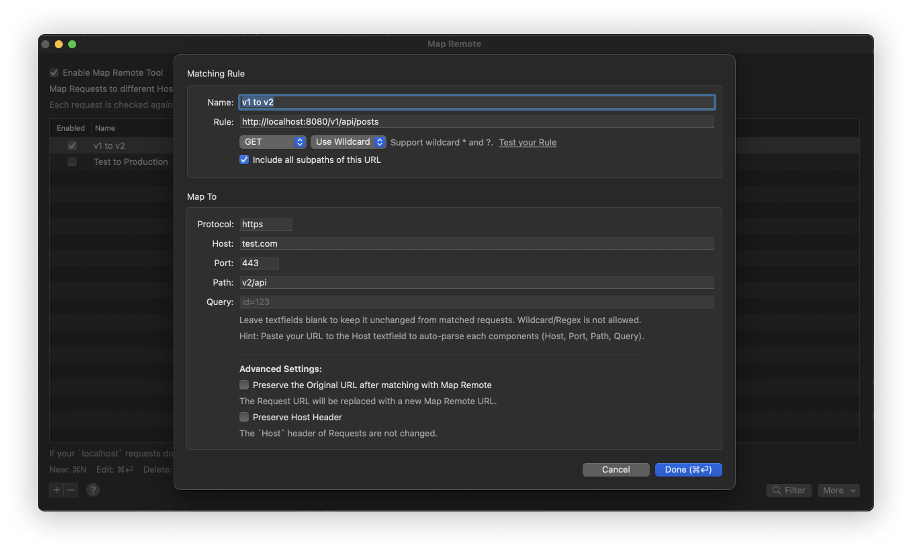
Map Remote would help the developer to change the HTTP request’s location to a new destination server, per the configured rules, so the HTTP response is transparently served from your client. This is particularly useful when you want to test your application against different backend environments without changing the codebase.
Use Cases:
- Use production endpoints on your development website on certain endpoints without changing the source code
- Use development endpoints on your production website
- Change certain request URLs to different destinations
- Replace request components such as protocol, host, port, path, or query on the fly
- Testing against multiple API versions (e.g., v1/v2)
- Avoiding hardcoded URLs in your application
- Seamlessly switching between environments for QA and production testing
Scripting
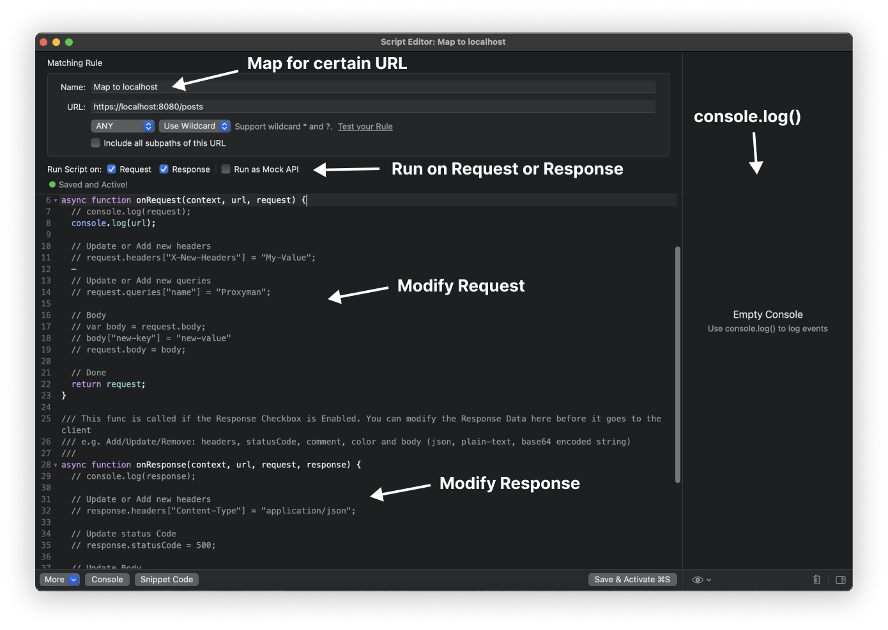
Scripting allows you to write custom JavaScript to manipulate requests and responses in a flexible way.
Features:
- Implement Map Local, Map Remote, or Breakpoints using Javascript code
- Change the request content, including domain, host, scheme, port, path, HTTP method, HTTP headers, query, and body (encoded form, JSON, plain text)
- Change the response content, including HTTP status code, headers, and body (JSON, encoded form, plain-text, binary)
- Provide built-in addons and libraries for common tasks, such as hashing, encoding/decoding, JSON – text transformer, and beautification
Use Cases:
- Injecting headers or query parameters for all requests matching certain criteria
- Logging and analyzing specific network patterns
- Simulating delays or network errors to test app resilience
GraphQL Support
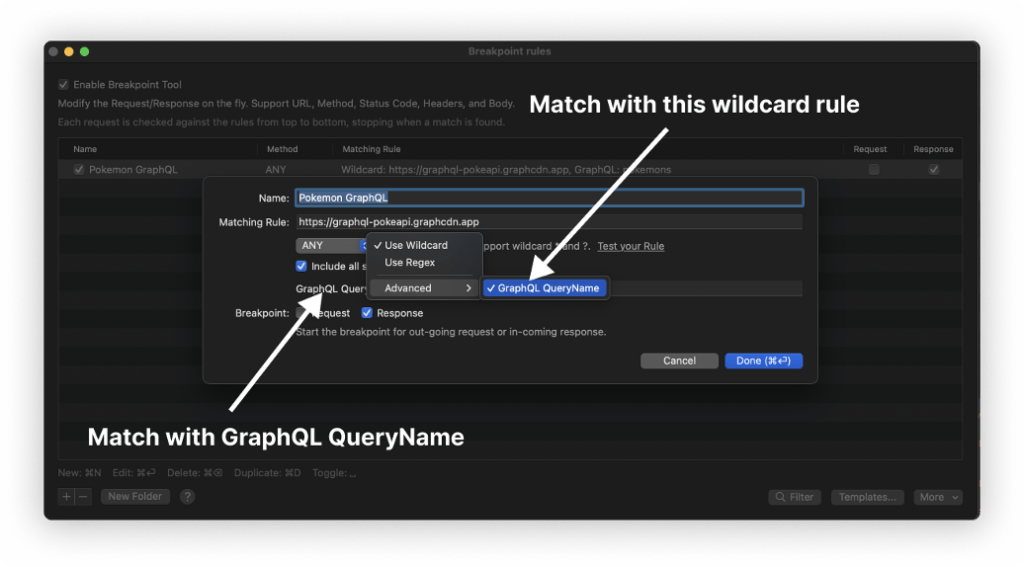
Proxyman offers specialized support for GraphQL, a query language for APIs that’s widely used in modern web applications, including those built with Vue.js
Features:
- Format and inspect GraphQL queries and mutations in an organized manner
- Modify GraphQL requests and responses to test different data retrieval scenarios
- Debug complex GraphQL interactions with ease
Use Cases:
- Ensuring that GraphQL queries are optimized and return expected data
- Testing how the application handles various GraphQL responses
- Debugging issues related to data fetching and state management
Summary
Effective debugging is vital for building high-quality Vue.js applications. By leveraging advanced console logging techniques, utilizing Vue Devtools for real-time insights, debugging Vue’s reactivity system, and employing tools like Proxyman for network debugging, developers can identify and resolve issues more efficiently. Understanding and applying these tools and methods not only speeds up the development process but also leads to more stable and performant applications.
Links
- https://developer.mozilla.org/en-US/docs/Web/API/Console_API
- https://devtools.vuejs.org
- https://vuejs.org/guide/extras/reactivity-in-depth
- https://docs.proxyman.io/
By Saulet Yskak, Software Developer at Klika Tech