
TABLE OF CONTENTS
Introduction
Monitoring is a key component of any modern infrastructure. In cloud environments like AWS it becomes even more critical because resources are highly dynamic, scale automatically and generate costs the moment they are provisioned. Without proper monitoring, teams may not only miss early signs of performance degradation or outages but also overlook silent inefficiencies that inflate bills. For example, unused capacity or throttled workloads may not run but they still create backlog or retries that consume resources and generate costs.
There are many monitoring solutions on the market but when it comes to AWS the native choice is Amazon CloudWatch. It integrates tightly with almost every AWS service, provides out-of-the-box metrics and allows engineers to set alarms, create dashboards and analyze logs without relying on third-party tools. CloudWatch is not just about metrics collection, it’s a central backbone system for observability in AWS.
In this article I’ll walk through a real debugging scenario with AWS Lambda. Using CloudWatch metrics we will analyze unexpected throttling behavior step by step. The journey will show not only how to interpret key Lambda metrics like Invocations, ConcurrentExecutions and GlobalThrottles but also how to connect the dots to uncover the true root cause. Finally, I’ll share the lessons learned and practical tips to avoid similar pitfalls in production.
Lambda and Its Metrics
AWS Lambda is one of the most popular serverless services in the AWS cloud. It allows you to run code without provisioning or managing servers. Instead of thinking about infrastructure you simply upload your code and define triggers. Whenever an event occurs, such as an HTTP request, a message in a queue, a change in a database or many other supported sources, AWS automatically runs a function. This pay-per-use model is attractive because you are charged only for the compute time your code consumes.
The most basic unit of Lambda usage is an invocation. An invocation represents a single execution of a Lambda function triggered by an event. For example, if an API Gateway endpoint receives 100 requests and each request invokes a Lambda function, that results in 100 invocations. Each invocation is measured separately in terms of duration, memory and success or failure.
In real-world systems you rarely have just one Lambda running. Production environments often contain dozens or even hundreds of different Lambda functions. More importantly, these functions can run simultaneously. This is where the concept of concurrent executions comes into play.
Concurrent executions represent the number of function instances that are running at the same time in a given region. If one function is processing 50 requests in parallel and another is processing 20 at the same time, your account’s total concurrent executions is 70. Concurrency matters because it reflects the actual load being handled by Lambda at a given moment and it is tied directly to AWS quotas.
By default each AWS account has a regional concurrency executions quota. For most regions the default value is 1000 concurrent executions. This means that across all your Lambda functions in that region, AWS allows up to 1000 executions running at once. If you need more you can submit a request to AWS Support and raise this limit. In practice many customers extend it to several thousands or even tens of thousands depending on their workload.
To understand and control how Lambda behaves under load, AWS exposes a rich set of CloudWatch metrics. Among the most important are:
- Invocations – counts the number of times a function is invoked, regardless of whether it succeeds or fails. This is the most basic measure of how often your function is used.
- Duration – measures how long your function code runs, from the time it starts executing until it returns or otherwise terminates. Duration is a key factor in cost and in estimating resource usage.
- Recursive invocations – measures how often a Lambda function ends up invoking itself, either directly or indirectly. This may indicate a configuration mistake or an infinite loop that can rapidly consume concurrency.
- Throttles – counts the number of invocation requests that were rejected because the function reached its concurrency limit or account concurrency limit. These throttled requests never started execution. Throttled requests and other invocation errors don’t count as either
InvocationsorErrors.
One more important thing to mention here is that lambdas have a configuration option called Reserved concurrency. For any individual Lambda function you can reserve a portion of the regional concurrency just for that function. Reserved concurrency guarantees that the function can always scale up to the reserved number but it also hold its maximum concurrency at that value. This is useful for critical functions that must never be starved of capacity or for limiting less critical functions so they do not overwhelm the system. Additionally, it can also act as a safeguard against recursive invocations. If a function accidentally invokes itself repeatedly, reserved concurrency ensures that it cannot grow beyond the defined limit and consume all available concurrency in the account.
These concepts, i.e. invocations, recursive invocations, duration, concurrency, throttles and reserved concurrency, form the foundation for understanding Lambda’s behavior at scale. Without clear visibility into them it becomes very hard to explain unexpected throttling, performance issues or cost anomalies.
Debugging Unexpected Global Throttles in Lambda
In this section I will walk through a step-by-step analysis of an issue that could appear in almost any AWS environment.
Imagine you have an AWS account with more than a hundred Lambda functions deployed. For these functions you have various CloudWatch alarms configured, including alarms for the Throttles metric.
One day you receive an alert that the number of throttles has exceeded the defined threshold – see Figure 1.
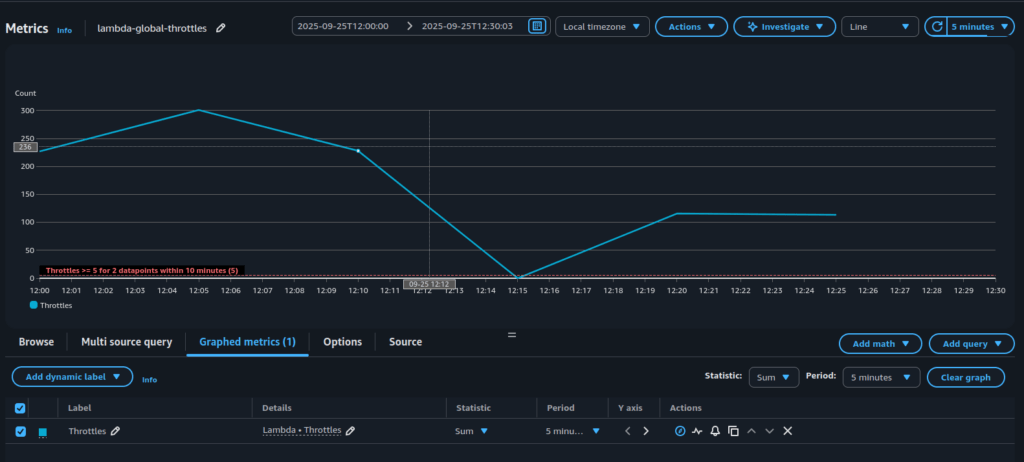
What does this actually mean?
It means that at the account level some Lambda functions were invoked but never started. The invocation request reached AWS Lambda but the service could not begin execution because there was no available concurrency left. From the application perspective this is not good, because the work you expected to be done was blocked at the very first step. Depending on the trigger this may cause different consequences: API requests might fail immediately, messages in a queue may pile up and create backlogs, or workflows in Step Functions may be delayed. In every case, throttling introduces risk that your system is not processing events as expected, users may see errors and downstream services can become overloaded with retries.
Faced with such an alert, the next logical step is to determine why throttling is occurring.
A good place to start debugging is by checking the Concurrent Executions quota. There is always a chance that the number of running functions has surpassed the value defined in the AWS account quotas (see Figure 2).
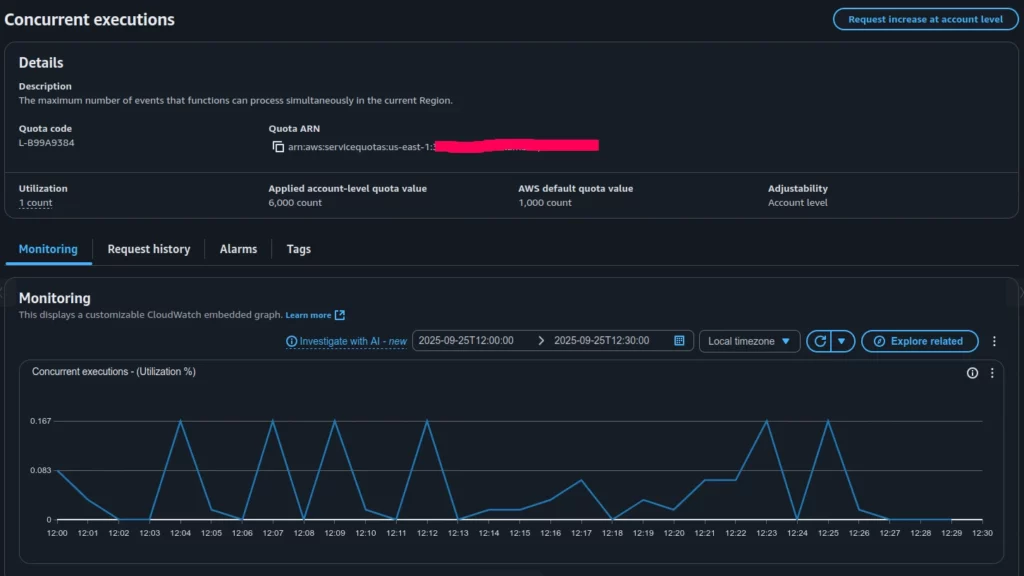
Based on the Concurrent Executions quota (Figure 2), the applied limit in our account is 6000 concurrent invocations, while the actual utilization is less than 1 percent. This clearly shows that all parallel Lambda invocations in the account are far from reaching the global limit and were not throttled at the account level.
This leads to the idea that we may be dealing with throttling caused by a specific Lambda function’s local quotas, possibly misconfigured in relation to its planned invocation rate. In such a case, individual functions can still be throttled even though the account-wide concurrency remains largely unused.
To investigate further, the next step is to look at the Throttles (Sum) graph, which presents the aggregated throttles across all Lambda functions (Figure 3).
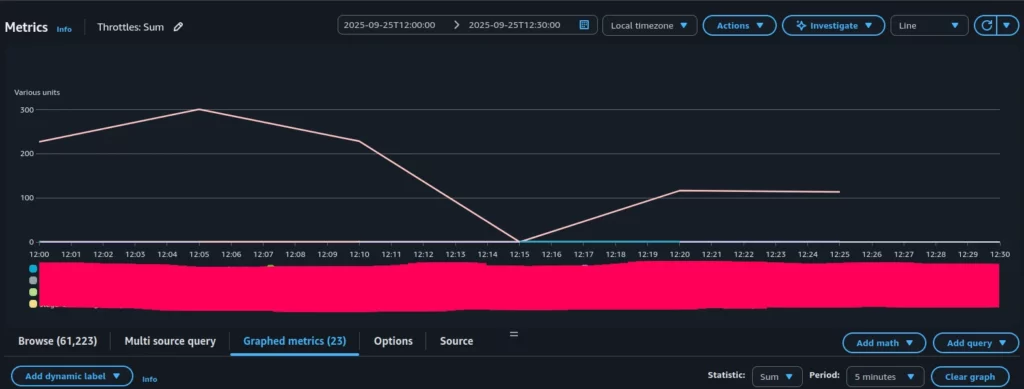
As can be seen, only one Lambda function shows significant throttling, while the rest have throttle metrics equal to zero.
Let’s explore the configuration of this particular function, focusing on its Reserved Concurrency setting (see Figure 4).
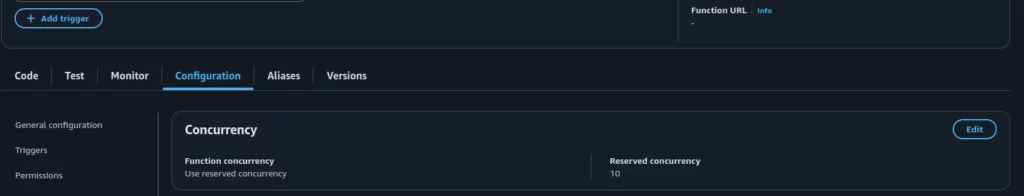
As shown in Figure 4, this Lambda function was configured to throttle invocations whenever it exceeded 10 concurrent executions.
Now let’s compare the Throttles and Invocations graphs for this specific function – see Figure 5 and Figure 6 correspondently.
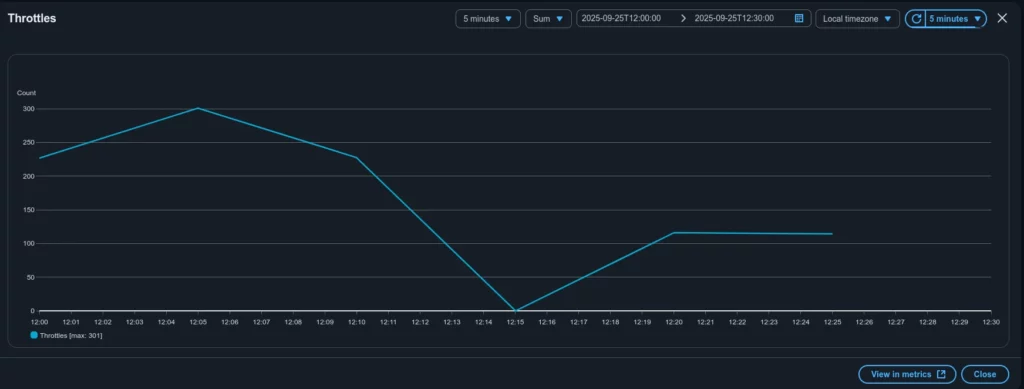
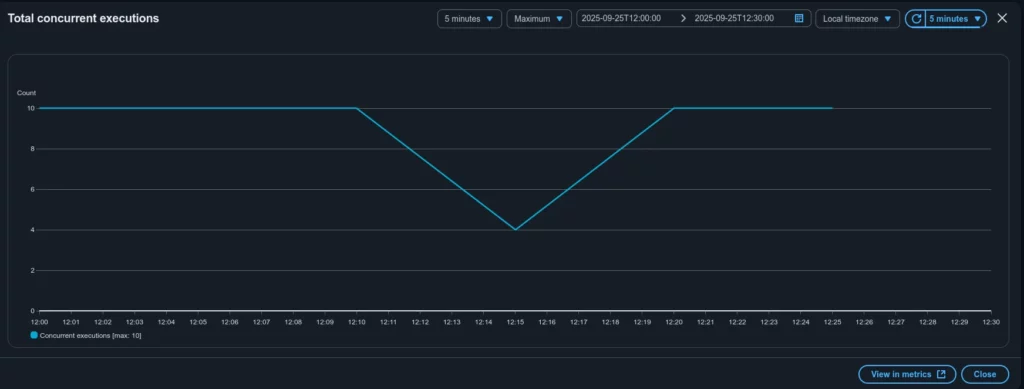
The graphs show that the total concurrent executions for this Lambda never exceeded 10, which matches the configured Reserved Concurrency. At the same time, roughly 300 Lambda invocations were throttled.
Case closed. The alert for the GlobalThrottles metric was caused by throttling in a specific Lambda function. The root reason was its preconfigured Reserved Concurrency (10), which did not match the actual execution demand for that function (around 300 at peak).
The next steps to mitigate the issue (which might not even be an issue in some contexts) should focus on understanding the nature of the mismatch between invocations and Reserved Concurrency. Key questions include: what triggers this Lambda, how often it is expected to be invoked, why Reserved Concurrency was set to 10 and what changes may have occurred recently; should the Reserved Concurrency value be increased or do we instead need to investigate the underlying reason for the growing demand on this function?
The exact follow-up actions depend on the particular system design and business requirements, which are beyond the scope of this article.
Conclusion
This article walked through a real case of investigating an alert on the Throttles metric in AWS Lambda. At first the numbers seemed contradictory: ConcurrentExecutions percentage usage was very low while hundreds of throttles were being reported. Step by step we reviewed the relevant CloudWatch metrics, checked account-level quotas and finally traced the issue to a single Lambda function with a Reserved Concurrency value set too low for its actual workload.
The key takeaway is that throttling does not always mean you have hit your account’s concurrency limit. In many cases the cause is local: function-level reserved concurrency, traffic bursts that exceed burst scaling or misalignments between expected and actual load. CloudWatch provides all the necessary data, but interpreting the metrics correctly is crucial to avoid confusion.
When faced with throttling alerts, always ask:
- Is the issue global (account-wide) or local (function-specific)?
- Do Reserved Concurrency settings align with the function’s real demand?
- Have traffic levels or triggering patterns changed recently?
Answering these questions not only resolves the immediate alert but also helps design more resilient, cost-efficient serverless architectures. In the end, the case we examined is less about a single misconfiguration and more about the importance of understanding how AWS Lambda metrics work together.
By Pavel Luksha, Senior DevOps Engineer, Klika Tech