TABLE OF CONTENTS
Introduction
Monitoring and alerting have always been a crucial part of the infrastructure independently, whether it is on-premise or in cloud. There are numerous technologies and techniques for its implementation to exist on the market.
In this article we are going to describe the architecture and implementation of the monitoring/alerting solution in the AWS multi account infrastructure (including AWS EKS) based on the Amazon Managed Prometheus (AMP), Amazon Managed Grafana (AMG) and AWS CloudWatch.
Input Data
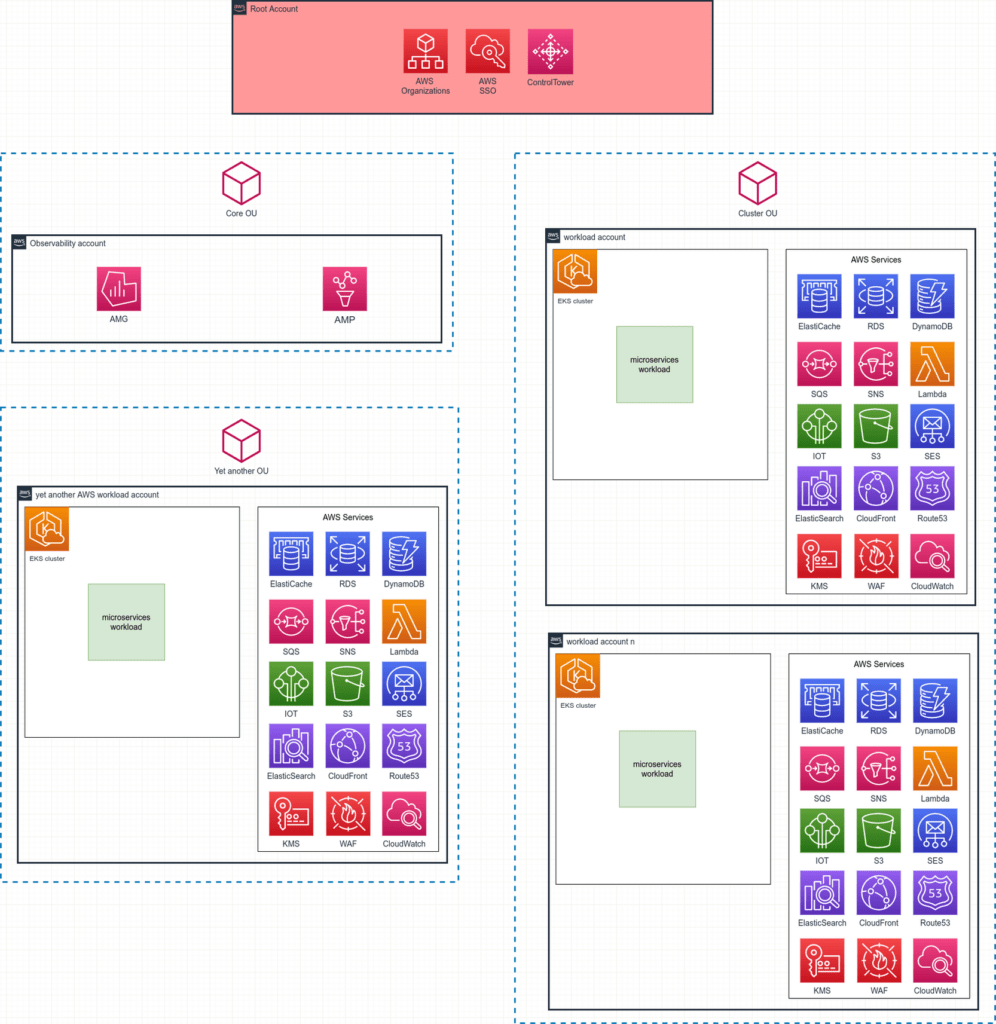
Let’s consider the multi account infrastructure in AWS with a number of the AWS services, including EKS clusters used. The AWS accounts architecture follows AWS Landing zone principles, i.e. there are a main root accounts with AWS Control Tower, AWS Organizations, AWS IAM Identity Center (former AWS SSO) services enabled. Within the AWS accounts there are numerous AWS services like SNS, SQS, RDS, Lambda, DynamoDB, CloudFront, EKS and many others. The diagram below (Figure 1) shows the structure of the AWS accounts.
As previously mentioned, there is the main root AWS account with AWS Control Tower, AWS Organizations, AWS IAM Identity Center (former AWS SSO) services deployed. Furthermore, there are several Organization Units (OUs) containing the AWS accounts. Each AWS account heavily uses numerous AWS services, including the EKS clusters which host a micro-services workload.
In addition, there is the “Core OU” containing an “Observability AWS account“, which is designed for aggregating all the infrastructure and workload metrics. The Amazon Managed Prometheus (AMP) and Amazon Managed Grafana (AMG) are deployed in the “Observability AWS account“. Later in the article this AWS account will be described in detail.
Monitoring
Looking at the AWS multi-account infrastructure diagram depicted in Figure 1, it becomes clear that a monitoring and alerting solution should be designed and implemented to allow developer engineers, infrastructure engineers, cloud engineers and even business owners to observe the state/status of the services they use.
First, let’s define what exactly we expect to monitor in the described infrastructure. We need to:
- monitor all the utilized AWS services deployed across all AWS accounts within the AWS Organizations
- monitor micro-services workloads running on EKS clusters across all AWS accounts within the AWS Organizations
- receive alerts for any issues with the infrastructure deployed across all AWS accounts within the AWS Organizations
Second, let’s define some basic criteria for the monitoring solution:
- We would like to have health dashboards for the services we use
- We would like to have one single web endpoint for all the health dashboards across all AWS accounts within the AWS Organizations
- There should be an integration between the AWS IAM Identity Center and the monitoring solution to authenticate and authorize the AWS IAM Identity Center users in a single web endpoint
Regardless of the benefits and drawbacks of any potential monitoring solution we might choose, let’s consider the following toolset, fulfilling the requirements above:
- Amazon Managed Grafana (AMG) is the fully managed AWS service for Grafana that enables us to query, visualize, and alert on the metrics coming from different data sources
- Amazon Managed Prometheus (AMP) is the AWS Prometheus-compatible service that monitors and provides alerts on containerized applications and infrastructure at scale. It acts as data source of metrics for the AMG and ensures storage for metrics for 150 days by default
- AWS CloudWatch is the AWS service that collects and visualizes real-time logs, metrics, and event data in automated dashboards to streamline your infrastructure and application maintenance
The architecture of the monitoring solution is shown in Figure 2.
Even though the diagram depicts the configuration for a single AWS workload account, bear in mind that since we have numerous AWS workload accounts, the configuration for all of them is identical.
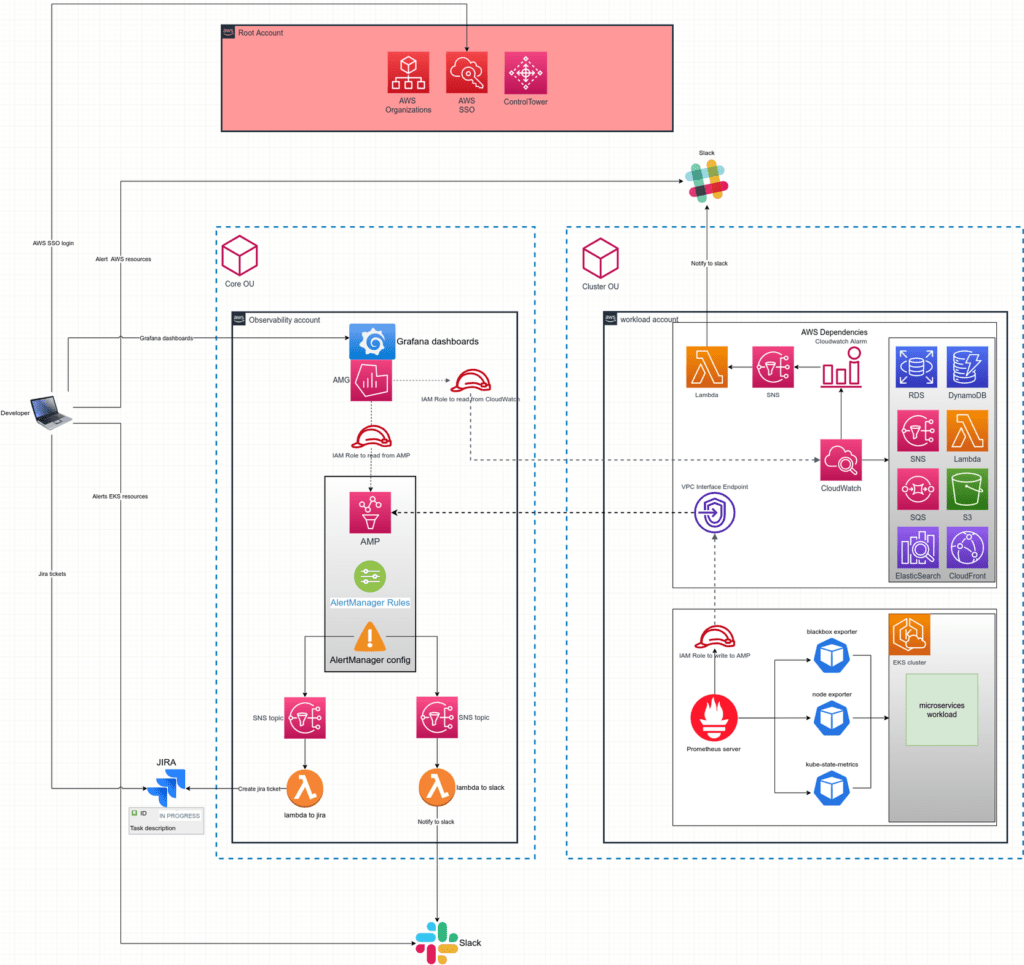
Now, let’s go through each monitoring component and determine the configurations that should be made.
Amazon Managed Grafana (AMG)
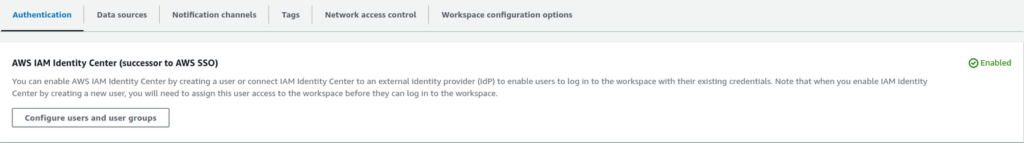
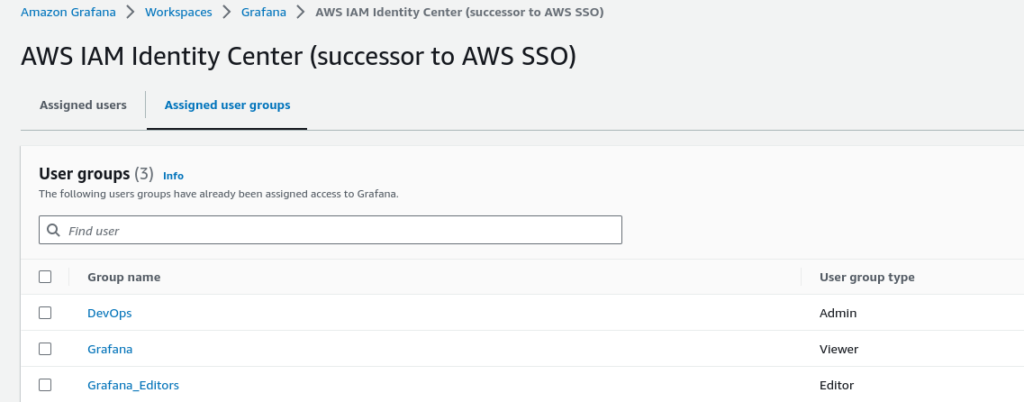
We deploy the AMG into the “Observability Account“, which resides in the “Core OU”. It is a fully managed HA AWS service, serving as a single web endpoint for all the health dashboards across all the AWS accounts. Additionally, AMG has a native integration with the AWS IAM Identity Center that empowers AWS users and groups to authenticate themselves in the AMG – see Figure 3.
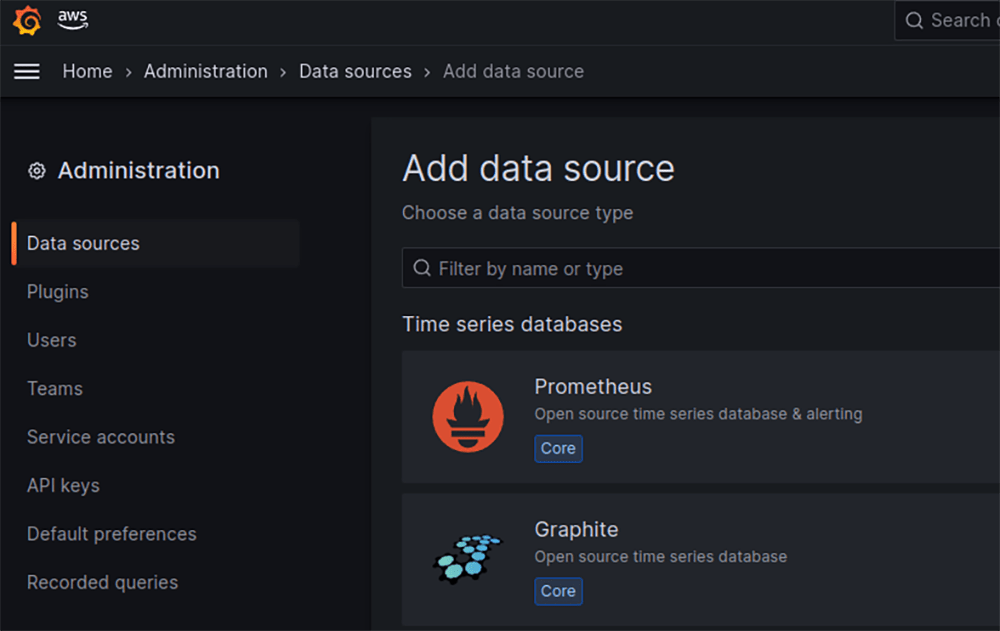
Moreover, there is a vast range of various metrics data sources that might be utilized by AMG, including Prometheus and CloudWatch data sources – see Figure 4.
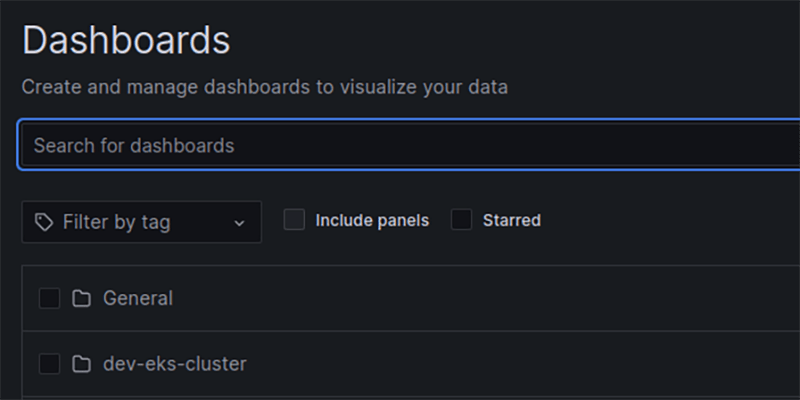
To elaborate further, we could structure all the visualization dashboards into folders, which reflect a monitored AWS account – see Figure 5.
For example, given that we have an AWS workload account named “dev-eks-cluster“, we could create the respective “dev-eks-cluster“ folder, which might contain Grafana dashboards related to that account.
Amazon Managed Prometheus (AMP)
As previously mentioned, AMP monitors and provides alerts related to containerized applications. Consequently, we could utilize it for ingesting metrics from the EKS clusters workload.
The AMP also acts as storage for metrics, ensuring the ability to check a dashboard’s history, even if an EKS cluster doesn’t exist anymore.
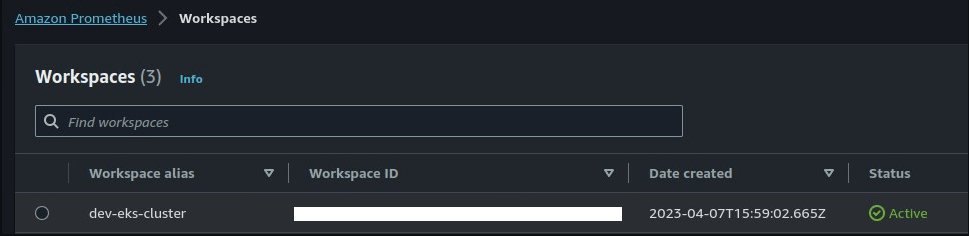
We could organize the AMP workspaces in ways to store metrics coming from different AWS accounts separately. For example, given that we have an AWS workload account named “dev-eks-cluster“, we could create the AMP workspace with the identical name and accumulate their metrics from the “dev-eks-cluster” AWS account – see Figure 6.
Subsequently, we could deploy as many AMP workspaces as AWS workload accounts we have.
Let’s examine the configuration required to send metrics from AWS workload accounts to a relevant AMP, deployed to the “Observability account“.
First, we need to collect metrics from the all EKS objects we need, i.e. nodes and pods statistics, EKS cluster statistics, health checks of pods’ endpoints and others. To do that we need to install a Prometheus server as well as all required exporters (node-exporter, kube-state-metrics-exporter, etc) on every EKS workload cluster.
Second, we need to configure the Prometheus server to send metrics to the relevant AMP, deployed in the “Observability account“. Since we need to ensure that services from the different AWS accounts (Prometheus server in EKS and AMP) can communicate between each other, we should make the Prometheus server from AWS “workload account” able to authorize itself during the negotiation with AMP in the “Observability account“. The AWS best practices for establishing cross-account access leverages on cross-account IAM roles.
Therefore, to send metrics from the EKS workload (deployed in the AWS workload account) to the relevant AMP (“deployed in the “Observability account“), we need:
- To create the IAM role (for example, “AMP-eks-workload-role“ in the AWS “Observability account“ and attach policy permissions, allowing it to write to the AMP (i.e., the managed AWS IAM policy “AmazonPrometheusRemoteWriteAccess“). Remarkably, the role must have trusted policies, permitting it to assume the role by the AWS workload account
- To attach the IAM role “AMP-eks-workload-role“ to the relevant AMP workspace
- To create IAM role in the AWS “workload account” with permissions to assume the IAM role from the AWS “Observability account“ (“AMP-eks-workload-role“) and attach it to the Prometheus server pod via k8s service account
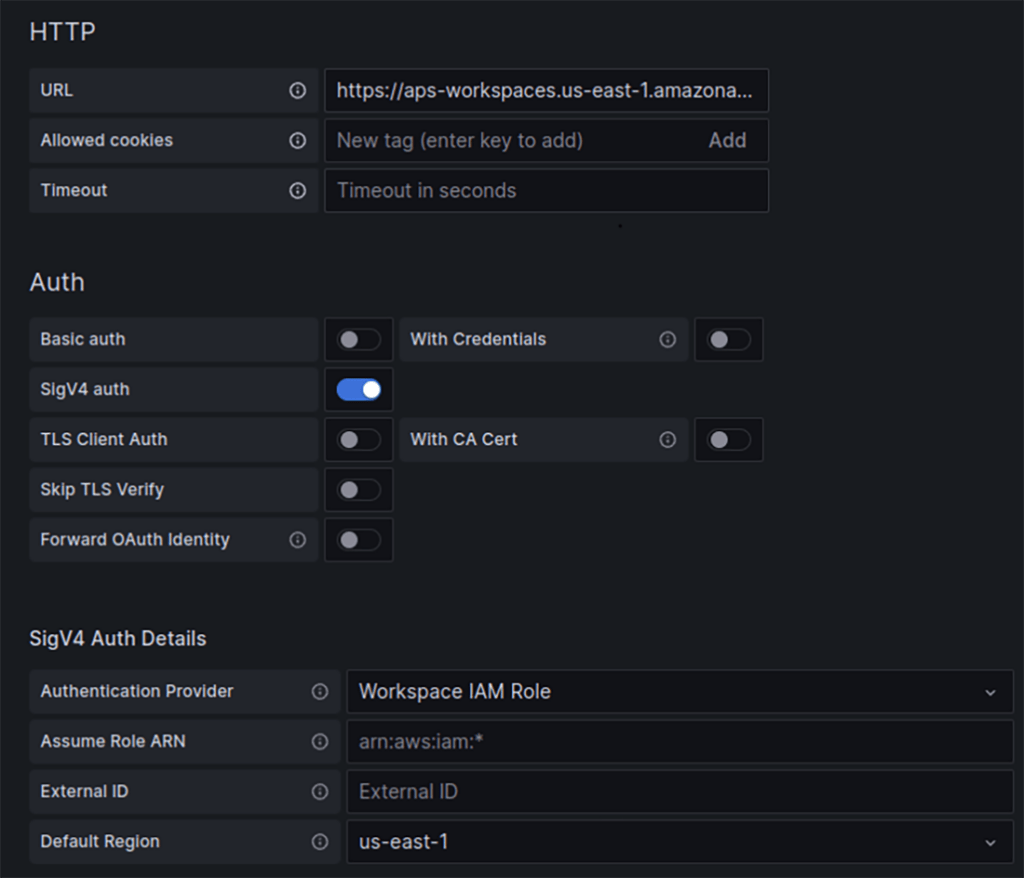
- To configure the Prometheus server to serve as a proxy, authorizing itself by assuming the IAM role from the AWS “Observability account“ (“AMP-eks-workload-role“):
...
    remoteWrite:
      - url: https://aps-workspaces.<region>.amazonaws.com/workspaces/<amp_workspace_id>/api/v1/remote_write
         sigv4:
          region: ${region}
          roleArn: arn:aws:iam::<AWS_Observability_account>:role/AMP-eks-workload-role
...- To create the AWS VPC Interface endpoint in the AWS workload account in order to transfer data between accounts through private AWS network.
Once it is done, new data sources, pointing to the relevant AMP, can be created in the AMG – see Figure 7
With the AMP data source in place we can create any Grafana dashboards we need.
AWS Cloudwatch
AWS Cloudwatch is the AWS service that collects and visualizes real-time logs and metrics.
As it is clear from the AMG paragraph, to visualize metrics data we rely on the AMG. To implement this we need to configure AWS Cloudwatch service across all AWS accounts in the all OU to stream metrics directly to the AMG, deployed in the AWS “Observability account“.
Because we need to ensure that the AWS CloudWatch service in the AWS “workload account” can communicate with AMG, which is deployed in the AWS “Observability account“, we should should enable CloudWatch service to authorize itself when negotiating with the AMP. To accomplish that, the same cross-account IAM roles approach can be used.
Therefore, what we need to do to send AWS CloudwWatch service metrics from AWS workload accounts to the AMG deployed to the “Observability account“ is:
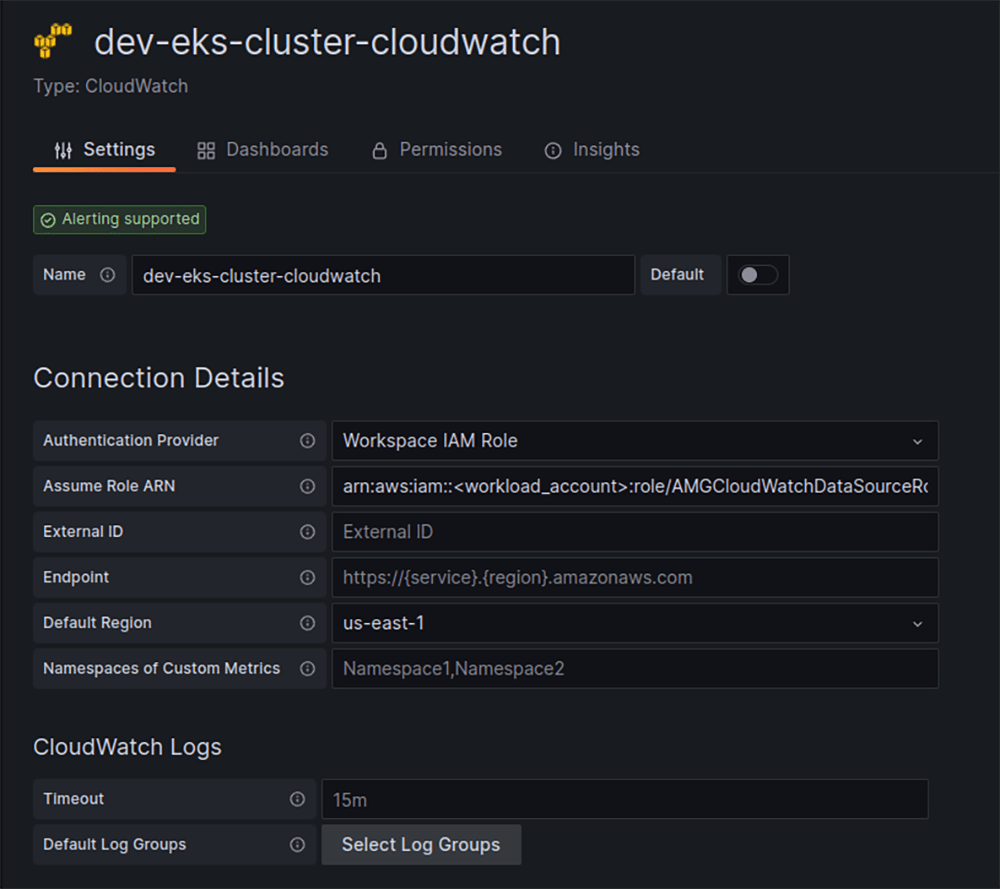
- Create an IAM role in the AWS “workload account” that has permissions to work with CloudWatch metrics (for example, “AMGCloudWatchDataSourceRole“) and to trust AWS “Observability account“ in order to be assumed.
- Create an IAM role (and attach it to the AMG) in the AWS “Observability account“ with the permissions to assume the IAM role from the AWS “workload account” (“AMGCloudWatchDataSourceRole“).
By having that in place, we can create a data source for CloudWatch metrics in the AMG and use that data source to build Grafana dashboards – see Figure 8
Alerting
Though having visualization dashboards is essential for monitoring, it is highly important to receive alerts about failing infrastructure.
Since we have metrics for both AWS services (from CloudWatch) and EKS workload (from Prometheus and AMP), there are different approaches to implement alerting.
Let’s describe them both.
AMG alerts
Because we have all the metrics in the AMG (both for CloudWatch and EKS Prometheus) we can configure alerts directly in the AMG, specifically, by using Grafana dashboard alerts
AMP alerts and AWS CloudWatch alarms
For the EKS workload (since we have EKS Prometheus metrics aggregated in the AMP) we can create alerts in the AMP.
In general, AMP alert configurations are aligned with the open-source Prometheus (alertmanager config and recording rules config). However, there is a surprising limitation – the only receiver available for AMP alertmanager is an AWS SNS service.
Taking that fact into consideration, the flow of the alerts looks like this:
Alert is fired in AMP → the alert is sent to the SNS topic → SNS topic sends message to a lambda → we could use lambda to send messages to anywhere (slack, create ticket in JIRA, etc)For the remaining AWS services, since we don’t have CloudWatch metrics aggregated in the AMP (they are directly ingested to the AMG) we can’t create AMP alerts. We prefer to leverage the native AWS CloudWatch alarms.
In this case the the flow of the alerts looks like this:
Alarm is fired in CloudWatch → the alert is sent to the SNS topic → SNS topic sends message to a lambda → we could use lambda to send messages to anywhere (slack, create ticket in JIRA, etc)There are upsides and downsides in both approaches, however let’s consider the approach with alerts based on the AMP alerts and AWS CloudWatch alarms.
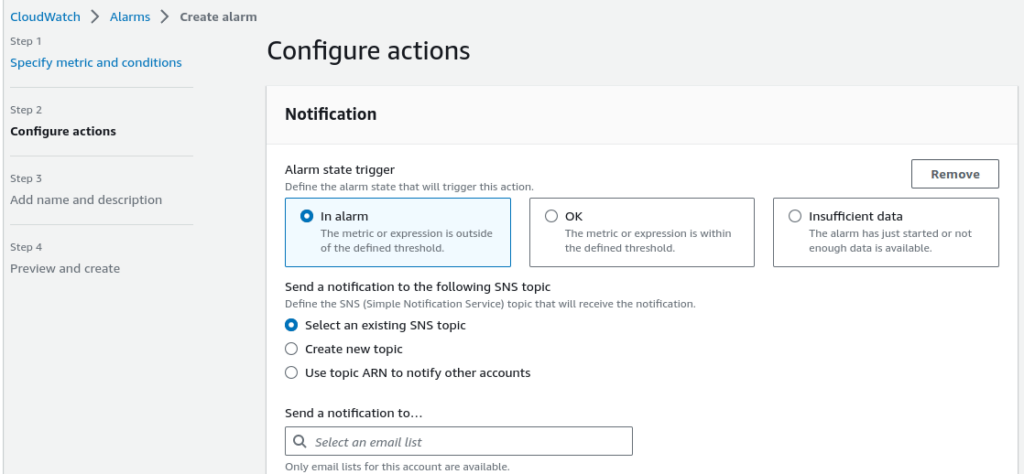
There is a lot of AWS documentation and best practice patterns describing configurations of AWS CloudWatch alarms. In short, we could basically use AWS CloudWatch alarms for almost everything in AWS. There are AWS services metrics stored in AWS CloudWatch which could be used to create alarms by using Statistics, Periods, Thresholds, etc – see Figure 9. As a destination for the CloudWatch alarms we can use AWS SNS – see see Figure 10.
Regarding the AMP alerts, as was mentioned earlier, AMP alerts configurations are aligned with the open-source Prometheus (alertmanager config and recording rules config).
Now, let’s examine the AMP alert configurations.
First, we need to configure the so-called “receiver flow“, i.e. SNS topics and Lambdas communication pipe. After this has been done, once the SNS topic receives the message, it triggers Lambda which could contain code to send messages to any destination you necessitate.
For example, there are two snippets representing code for sending messages to slack and for creating tickets in Jira.
...
def lambda_handler(event: Dict[str, Any], context: Dict[str, Any]) -> str:
    """
    Lambda function to parse notification events and forward to Slack
    :param event: lambda expected event object
    :param context: lambda expected context object
    :returns: none
    """
    if os.environ.get("LOG_EVENTS", "False") == "True":
        logging.info(f"Event logging enabled: `{json.dumps(event)}`")
    print("EVENT received from SNS:", event)
    for record in event["Records"]:
        sns = record["Sns"]
        subject = sns["Subject"]
        message = sns["Message"]
        region = sns["TopicArn"].split(":")[3]
        payload = get_slack_message_payload(
            message=message, region=region, subject=subject
        )
        # print("Payload to send to slack:", payload)
        response = send_slack_notification(payload=payload)
    if json.loads(response)["code"] != 200:
        response_info = json.loads(response)["info"]
        print(
          f"Error: received status `{response_info}` using event `{event}` and context `{context}`"
        )
        logging.error(
            f"Error: received status `{response_info}` using event `{event}` and context `{context}`"
        )
    return response
...
def lambda_handler(event, context):
jira_server_url = os.environ.get("JIRA_SERVER_URL_ENV")
jira_reporter_email = os.environ.get("JIRA_REPORTER_EMAIL_ENV")
jira_token = os.environ.get("JIRA_TOKEN_ENV")
jira_project_name = os.environ.get("JIRA_PROJECT_NAME_ENV")
jira_ticket_summary = os.environ.get("JIRA_TICKET_SUMMARY_ENV")
jira_ticket_description = os.environ.get("JIRA_TICKET_DESCRIPTION_ENV")
jira_issue_type = os.environ.get("JIRA_ISSUE_TYPE_ENV")
jira_priority = int(os.environ.get("JIRA_PRIORITY_ENV"))
jira_labels = os.environ.get("JIRA_LABELS_ENV")
jira_list_issues = os.environ.get("JIRA_LIST_ISSUES_ENV")
priorities = {
1: "1: Lowest / Trivial",
2: "2: Low / Annoying",
3: "3: Medium / Problematic",
4: "4: High / Critical",
5: "5: Highest / Blocker"
}
print(f"Lambda has been triggered by SNS, alert is firing")
try:
labels = [x.replace(" ", "-") for x in jira_labels.split(",")]
list_issues = jira_list_issues.split(",")
print("JIRA Parameters ready")
# Create instance of jira class
jira = JiraAutomation(project_name=jira_project_name, server_url=jira_server_url, reporter_email=jira_reporter_email, token=jira_token, priorities=priorities)
print("JIRA Instance ready")
# Create ticket with information
ticket, is_new = jira.generate_ticket(summary=jira_ticket_summary, description=jira_ticket_description, list_issues=list_issues, priority=jira_priority, labels=labels, issue_type=jira_issue_type)
print(f"JIRA ticket: {ticket}")
# Success case
return {
'headers': {
'Content-Type': 'application/json'
},
'statusCode': 201 if is_new else 200,
'body': {
'data': {
'ticket' : f"{ticket}",
'is_new': f"{is_new}"
},
'errors': []
},
}
except Exception as e:
# Unhandled error
print(f"Exception: {e}")
return {
'headers': {
'Content-Type': 'application/json'
},
'statusCode': 500,
'body': {
'data': {},
'errors': [
{"message": f"{e}"}
],
},
}
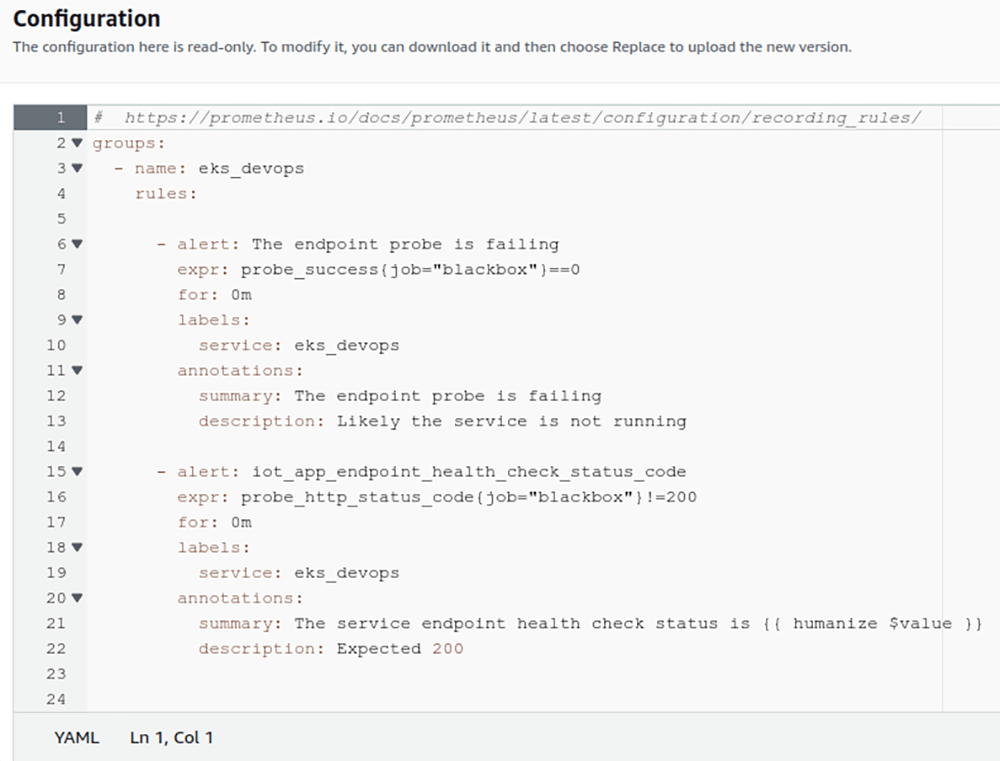
Second, we should configure AMP recording rules config – see Figure 11
All the documentation related to the Prometheus recording rules is described in the official documentation Recording rules | Prometheus
And finally, we should create an alertmanager config for the AMP.
Below is an example of the alertmanager config for the AMP:
alertmanager_config: |
  global:
  templates:
    - 'default_template'
  route:
    # https://prometheus.io/docs/alerting/latest/configuration/
    # Default route for DEVOPS team
    receiver: 'eks_devops'
    group_by: [team]
    group_wait: 5s
    group_interval: 5m
    repeat_interval: 10m
    routes:
    # All alerts with the service=<name_of_the_service> label match this sub-route.
    - receiver: 'eks_devops'
      group_by: [service]
      matchers:
        - service = eks_devops
  receivers:
    - name: 'eks_devops'
      sns_configs:
      - topic_arn: arn:aws:sns:us-east-1:<AWS_Observability_account“>:<Name_of_the_SNS_topic>
        sigv4:
          region: us-east-1
        send_resolved: true
All the documentation related to the Prometheus alertmanager is described in the official documentation Alerting rules | Prometheus .
As previously mentioned, the SNS topic serves as the Prometheus receiver.
Once all the configuration have been made, if alert is fired in the AMP, the AMP sends the message to the SNS topic, which, in turn, triggers Lambda, that sends messages to the recipient, as defined in the lLambda’s code base.
Conclusion
The article describes the architecture and implementation of the monitoring/alerting solution in the AWS multi account infrastructure (including AWS EKS) based on the Amazon Managed Prometheus (AMP), Amazon Managed Grafana (AMG) and AWS CloudWatch. The architecture diagram of the considered solution, encompassing all the components we described in the article, is shown on Figure 1. We demonstrated that we could design and implement a dedicated AWS Observability account (with AMG and AMPs deployed there) aimed to aggregate all the metrics from all the AWS workload accounts, visualize them by using Grafana dashboards and create AMP alerts. For the sake of simplicity, we presented the configuration for only a single AWS workload account, though this pattern can be scaled for a numerous AWS workload accounts.
Remarkably, the infrastructure components that are covered in this article might and should be provisioned by utilizing IaaC approach.
By Pavel Luksha, Senior DevOps Engineer at Klika Tech, Inc.