


TABLE OF CONTENTS
Domain 2: Security Logging and Monitoring
See the previous part: “Security in AWS – Part 1”
Any secure cloud environment relies not only on prevention but also on the ability to observe what is happening inside it. Logging and monitoring make it possible to detect unexpected behavior, investigate incidents and confirm that protective controls continue to work as intended. In AWS, these capabilities extend from network boundaries to application layers and provide the evidence needed for both operational insight and compliance.
This domain focuses on how AWS gathers activity data, aggregates it, and turns it into actionable information. Services such as Amazon CloudWatch, Amazon EventBridge, Amazon S3 Events, Amazon Simple Notification Service (SNS), Amazon Inspector, VPC Flow Logs, and AWS Trusted AdvisorCloudTrail form the backbone of that ecosystem. Each contributes a specific perspective: metrics and logs, real-time alerts, vulnerability checks or audit trails that trace every API call.
The following overview shows the purpose of each service and how they complement one another to create visibility across the AWS environment.
Amazon Cloud Watch
Amazon CloudWatch serves as the main observation point for everything running in AWS. It gathers data from applications, operating systems and cloud services, then turns that information into a single view of how systems behave. This makes it easier to notice performance issues, configuration errors or early signs of a security problem. CloudWatch can be considered a system from the three key elements: Logs, Metrics, and Alarms.
CloudWatch Logs store detailed records of what systems and applications are doing. Each log group can represent an application or an environment, while log streams hold specific event data from servers or containers. These logs are encrypted with AWS Key Management Service (KMS) and can be stored for as long as required for compliance or investigation purposes. They can also be sent to Amazon S3 or Amazon OpenSearch Service for long-term analysis or visualization. Logs are the written history of system activity, helping engineers understand what happened and when.
CloudWatch Metrics provide the numerical side of monitoring. They track measurable aspects of performance, such as CPU utilization, API error rates or network latency. Applications can also publish their own custom metrics to extend observability beyond what AWS collects automatically. By watching how these values change over time, teams can recognize patterns, forecast capacity needs and detect anomalies that may suggest performance degradation or suspicious behavior.
CloudWatch Alarms add automation to the process. Each alarm monitors one or more metrics and compares them to a defined threshold. When the condition is met, it changes state and can immediately trigger a response. For instance, an alarm can notify through Amazon SNS and call a Lambda function to take corrective action. This turns passive monitoring into active management, where systems can react as soon as something unusual occurs.
By working together with other services such as CloudTrail and VPC Flow Logs, CloudWatch gives a complete picture of what is happening across AWS. Activity seen in CloudTrail can be connected to network data from Flow Logs and to system performance metrics, providing full context around any event.
In practice, CloudWatch is both the daily dashboard for normal operations and the foundation for security visibility. It continuously measures the state of the environment and ensures that every relevant signal can be captured, analyzed and acted upon without delay.
Amazon EventBridge
Amazon EventBridge acts as the communication hub for AWS monitoring and automation. It collects events from across AWS services and custom applications, then routes them to specific targets for processing or response. By connecting detection sources with automated workflows, EventBridge makes it possible to react to changes in real time without manual intervention.
When AWS CloudTrail logs a new API action, when Amazon GuardDuty detects a potential threat, or when Amazon Inspector reports a vulnerability, Amazon EventBridge can immediately forward that information to other AWS services. The target could be a Lambda function that performs automated remediation, an SNS topic that alerts a security team or a Step Functions workflow that coordinates a more complex response. This event-driven design allows systems to act on what happens rather than waiting for scheduled checks or manual reviews.
EventBridge supports flexible filtering through event patterns that match specific attributes, such as the source service, event name or affected resource. This filtering ensures that only relevant events trigger downstream actions, keeping automation precise and preventing alert fatigue. It can also handle cross-account and cross-region routing, allowing large organizations to centralize monitoring and incident response across multiple environments.
In a mature AWS environment, EventBridge functions as the nervous system that connects every monitoring and detection component. It ensures that when something important happens anywhere in the cloud, the right tools and people are notified instantly and the right corrective actions begin automatically.
Amazon S3 Events
Amazon S3 Events make it possible to track what is happening inside S3 buckets in real time. Whenever an object is created, modified or deleted, S3 can automatically send a notification to other AWS services such as EventBridge, Lambda or SNS. This feature turns simple storage into an active source of monitoring data.
For example, a notification can be triggered every time a new file is uploaded. That event can start a Lambda function that checks whether the file is encrypted, scans it for malware or classifies its content. Notifications can also be used to log object deletions or updates, which helps maintain accurate audit trails and supports compliance reviews.
When Amazon S3 events are used together with CloudTrail data events, they create a complete view of bucket activity. AWS CloudTrail records who performed each action and from where the request originated, while Amazon S3 event notifications show exactly which objects were affected. Together, they give security teams and developers clear insight into how data is being used and changed over time.
Amazon Simple Notification Service (SNS)
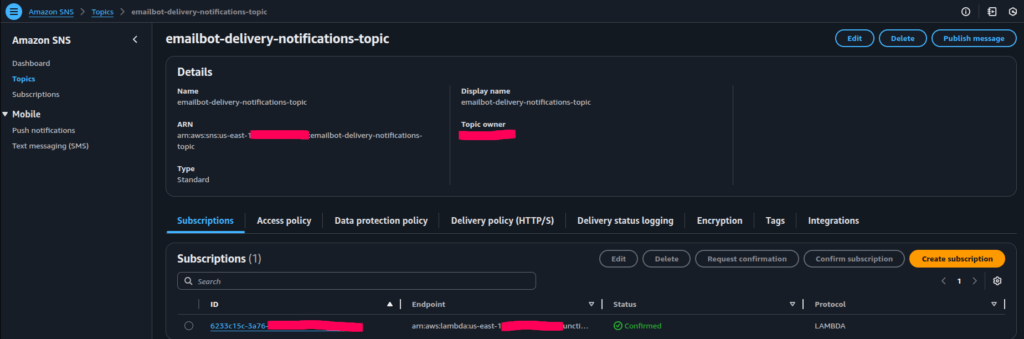
Amazon Simple Notification Service (SNS) is the main tool in AWS for sending alerts and notifications when something important happens. It acts as a bridge between systems that detect events and the people or tools that need to know about them. Whenever a monitoring service identifies a potential problem or change, SNS can instantly deliver that information through different channels such as email, text message (SMS) or direct communication with another application or service.
For example, if a CloudWatch alarm detects that a server is under heavy load or an Inspector scan finds a new vulnerability, SNS can send an alert to the security team’s email or trigger an automated workflow using AWS Lambda. This helps ensure that issues are seen quickly and can be investigated or resolved before they escalate.
SNS uses a simple concept of topics and subscriptions. A topic is like a mailbox for alerts. Different systems can publish messages to a topic, so anyone or anything subscribed to that topic receives the notification. This makes it easy to notify multiple teams or systems at once.
To protect sensitive information, all messages can be encrypted using AWS Key Management Service (KMS).
Amazon Inspector
Amazon Inspector is a security service that continuously checks AWS resources for vulnerabilities and weaknesses. It works automatically in the background, scanning compute instances (EC2), container images stored in Amazon ECR and even serverless functions in AWS Lambda. The goal of Inspector is to identify known security risks, such as outdated software, missing patches or unsafe configurations.
When Inspector runs a scan, it compares what it finds against a large database of known security issues, called CVEs (Common Vulnerabilities and Exposures). For example, if an EC2 instance is running an old version of an operating system with a public security flaw, Inspector flags it. The same applies to container images that use outdated libraries or Lambda functions that rely on vulnerable dependencies.
Each finding from Inspector includes details such as the affected resource, the severity of the issue and recommended actions for fixing it. These findings are automatically sent to AWS Security Hub for centralized tracking and to Amazon EventBridge, which can trigger alerts or automated remediation steps. This integration allows organizations to respond to issues quickly, without constant manual checks.
In simple terms, Amazon Inspector acts as a security auditor that never sleeps. It constantly reviews systems for weaknesses, prioritizes what needs attention and makes sure that the organization always has a current view of its security posture.
VPC Flow Logs
VPC Flow Logs record detailed information about the network traffic (but don’t include the content of data) moving in and out of resources inside an AWS Virtual Private Cloud (VPC). They show which connections were accepted or rejected, which IP addresses were involved and how much data was transferred. In other words, Flow Logs give a behind-the-scenes view of how different parts of a cloud environment communicate.
These logs can be stored in Amazon CloudWatch Logs or Amazon S3 where they can be filtered, searched and analyzed. By studying this data, it becomes possible to spot unusual or risky patterns. For example, if a private system suddenly starts sending data to an unknown external IP address, Flow Logs can help identify it. They are also useful for tracking internal traffic within a network to detect cases where one system starts communicating with another that it normally should not.
From a security perspective, Flow Logs are essential for both investigation and prevention. They help confirm whether firewalls and security groups are working as expected and provide evidence during audits or incident reviews. Because they record every connection attempt, they can be used to reconstruct how an intrusion or data transfer occurred.
Enabling Flow Logs for all subnets and storing them centrally in S3 or CloudWatch Logs ensures that network activity is consistently tracked across the entire environment. Keeping these logs for a defined retention period and applying lifecycle policies for storage optimization allows organizations to maintain a reliable history of network behavior without excessive cost.
AWS Trusted Advisor
AWS Trusted Advisor is a service that acts like a built-in consultant for cloud environments. It continuously reviews how resources are configured and looks for ways to improve security, performance and cost efficiency. Rather than waiting for problems to appear, Trusted Advisor highlights potential risks and optimization opportunities before they affect operations.
One of its most valuable sections is the Security category. It checks for common but serious issues, such as not having multi-factor authentication (MFA) enabled on the root account, using weak password policies or leaving S3 buckets publicly accessible. It also identifies security groups that allow unrestricted access to sensitive ports like SSH or RDP. These findings help ensure that basic but critical protections are always in place.
Trusted Advisor is also useful from a management and compliance perspective. Its results can be viewed across all AWS accounts through AWS Organizations, providing a single overview of the organization’s overall security posture. The findings can be automatically sent to AWS Security Hub, where they appear alongside other security alerts, making it easier to track and prioritize what needs attention.
In simple words, AWS Trusted Advisor works like a continuous safety and efficiency checklist for the cloud. It helps maintain a secure and well-tuned environment by regularly scanning configurations and giving clear recommendations for improvement.
AWS CloudTrail
AWS CloudTrail is one of the most important services for maintaining visibility and accountability in the cloud. It records every API action taken inside an AWS environment, showing who did what, when, and from where. Whether an action was made through the AWS Management Console, the command-line interface (CLI) or an application using the AWS SDK, CloudTrail captures it. This creates a detailed record of all activity across accounts and services.
There are two main types of events that CloudTrail collects. Management events track changes to AWS resources, such as creating a new IAM role, modifying a security group or deleting an S3 bucket. Data events provide deeper visibility by recording access to specific objects, such as reading a file from S3 or invoking a Lambda function. Together, they make it possible to understand both the administrative actions and the data interactions taking place in an environment.
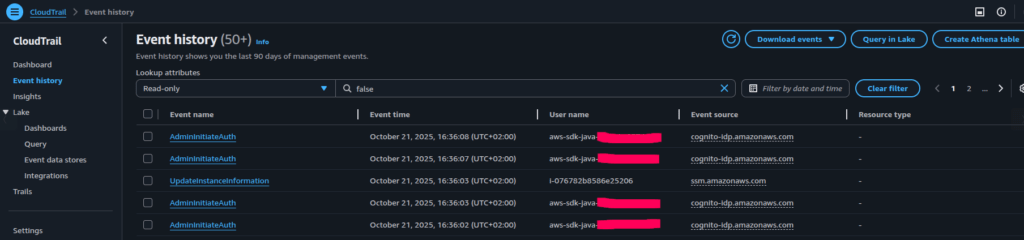
To keep these logs secure and easy to manage, it is considered best practice to enable CloudTrail across all AWS accounts and regions under a single organization. Logs should be delivered to an Amazon S3 bucket that is encrypted and stored in a dedicated logging account. This separation ensures that even if another account is compromised, the activity records remain safe and tamper-proof. For near real-time monitoring, CloudTrail can also send its events to Amazon CloudWatch Logs, allowing immediate alerts or automated responses when specific actions occur.
CloudTrail is often described as the “black box recorder” of AWS because it provides the full history of what has happened in the environment. When an investigation or audit is needed, these logs reveal the exact sequence of actions, who initiated them and what resources were affected.
Real-Use Case Scenario
In this section, I will provide an example of a situation that might occur in a AWS environment and illustrate the typical debug steps taken to identify and resolve the issue by using the AWS security logging and monitoring services described in this article.
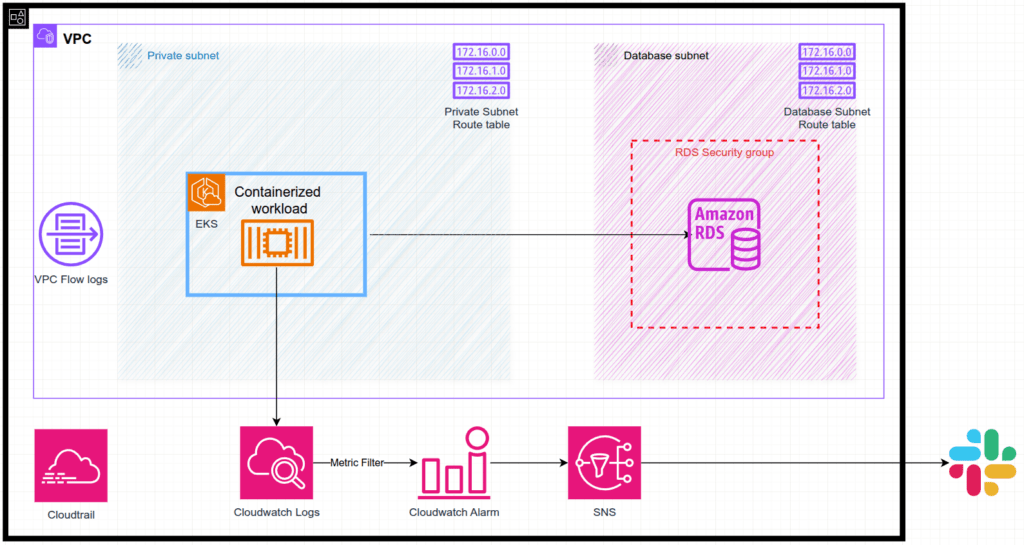
Imagine an architecture (see Figure 3) where an application runs inside private subnets in an Amazon EKS cluster within a VPC. The application needs a database, so an Amazon RDS instance is deployed in a dedicated database subnet. To strengthen network security, a security group is created and attached to the RDS instance, allowing inbound access to the database only from the private subnet CIDR range.
The application sends its logs to Amazon CloudWatch Logs. The application is configured to start log messages with the word “ERROR“ when it throws the application errors related to the infrastructure layer (for example, “connection timeout“ errors). Consequently, based on these logs, a metric filter is configured to count the occurrences of the word “ERROR”.
This metric is then used by a CloudWatch Alarm, which triggers whenever the number of errors exceeds a defined threshold. The CloudWatch Alarm notifies an Amazon SNS topic, which in turn sends the alert to a Slack channel to inform the team.
Let’s say one day a DevOps team (hereinafter referred to as “we”) receives a CloudWatch alarm notification indicating that the application logs contain an unusually high number of “ERROR” entries.
🚨 ALARM: AppErrorRateHigh
Region: us-east-1
Metric: ErrorCount (Threshold ≥ 5)
Current Value: 17
Log Group: /eks/service
🔍 Check CloudWatch Logs for “Error” events.
The first step of debugging is checking the application logs. We need to go to the CloudWatch Logs, find the the relevant CloudWatch group and check the most recent CloudWatch log stream.
In the logs, we might find repeated database connection errors:
2025-06-22T10:12:42Z ERROR [db-connection] Failed to connect to database
Error: dial tcp 172.16.45.22:3306: connect: connection timed out
Retrying in 5s...
At this point we check the RDS instance. If there were a problem with the database itself, we would address it. However, let’s assume that RDS appears healthy, i.e. CPU, connections and storage metrics look normal. This suggests that the issue likely lies in the network path between the application and the database.
To verify this, we enable VPC Flow Logs on the ENI (Elastic Network Interface) of the worker node from which the application communicates with RDS. Enabling flow logs at the ENI level gives the most accurate view of actual network traffic originating from the application.
Once enabled, the flow logs begin capturing all inbound and outbound network flow information. In the logs, we observe that traffic is leaving the application ENI on port 3306, but the packets are being rejected when attempting to reach the RDS endpoint.
2 123456789012 eni-0aa1b2c3d4e5f6789 172.16.21.45 172.16.45.22 55831 3306 6 3 0 1719060782 1719060842 REJECT OK
2 123456789012 eni-0aa1b2c3d4e5f6789 172.16.21.45 172.16.45.22 55832 3306 6 3 0 1719060842 1719060902 REJECT OK
From my experience, in a majority of cases when the packet got rejected (“REJECT” in the VPC log) it is either ACL or SG. In this real-case example we don’t use ACLs so the traffic is rejected most likely due to missing or incorrect security group rules.
Upon reviewing the RDS security group, we notice that the inbound rule allowing access from the application’s security group is missing. After adding the appropriate inbound rule (for example, TCP port 3306 from the app’s security group), the application immediately restores its database connectivity and starts working normally again.
The additional step we could make is to determine who made the change. For this, we check AWS CloudTrail for recent events related to the RDS security group:
{
  "eventVersion": "1.08",
  "userIdentity": {
    "type": "IAMUser",
    "principalId": "AIDAEXAMPLE123456789",
    "arn": "arn:aws:iam::123456789012:user/devops-engineer",
    "accountId": "123456789012",
    "userName": "devops-engineer"
  },
  "eventTime": "2025-06-22T09:50:12Z",
  "eventSource": "ec2.amazonaws.com",
  "eventName": "RevokeSecurityGroupIngress",
  "awsRegion": "us-east-1",
  "sourceIPAddress": "203.0.113.45",
  "userAgent": "Mozilla/5.0 (X11; Ubuntu; Linux x86_64; rv:144.0) Gecko/20100101 Firefox/144.0",
    "requestParameters": {
        "groupId": "sg-0f357e637ae4c1111",
        "ipPermissions": {
            "items": [
                {
                    "ipProtocol": "tcp",
                    "fromPort": 3306,
                    "toPort": 3306,
                    "groups": {},
                    "ipRanges": {
                        "items": [
                            {
                                "cidrIp": "172.16.0.1/16"
                            }
                        ]
                    },
                    "ipv6Ranges": {},
                    "prefixListIds": {}
                }
            ]
        }
    },
  "responseElements": {
...
}
From this CloudTrail record, we can see that a user named “devops-engineer” manually revoked the ingress rule that allowed database traffic from the application’s security group.
In this step the debugging session example is completed. In the session we demonstrated how AWS security logging and monitoring services, such as CloudWatch Logs, CloudWatch Alarms, VPC Flow Logs and CloudTrail, can be leveraged to identify an application issue, determine the root cause, and trace the identity of the user who introduced the change.
In the next sections a short description of AWS security Logging and monitoring is given.
Security Logging and Monitoring Recap
| Function | Primary Services | Objective |
|---|---|---|
| Metrics and logs | CloudWatch, VPC Flow Logs | Observe and detect anomalies |
| Event routing | EventBridge, S3 Events, SNS | Connect detection sources to automated actions |
| Vulnerability detection | Amazon Inspector | Identify and track known weaknesses |
| Best practices | Trusted Advisor | Highlight misconfigurations and exposure risks |
| Activity audit | AWS CloudTrail | Record API-level actions |
See the next part Security in AWS – Part 3
By Pavel Luksha, Senior DevOps Engineer, Klika Tech, Inc.